TradeLux Research Desk
A trading content hub built to be read, searched, and actually used.
Browse operator-grade tutorials on automation, market structure, technical analysis, funded-trader workflow, and the process habits that make live execution cleaner.
How to use this hub
Start with the pillar that matches the decision you are trying to improve.
Use search to narrow down a setup, checklist, or operational problem.
Open the long-form guide, use the table of contents, and keep the framework card beside the article while you review.
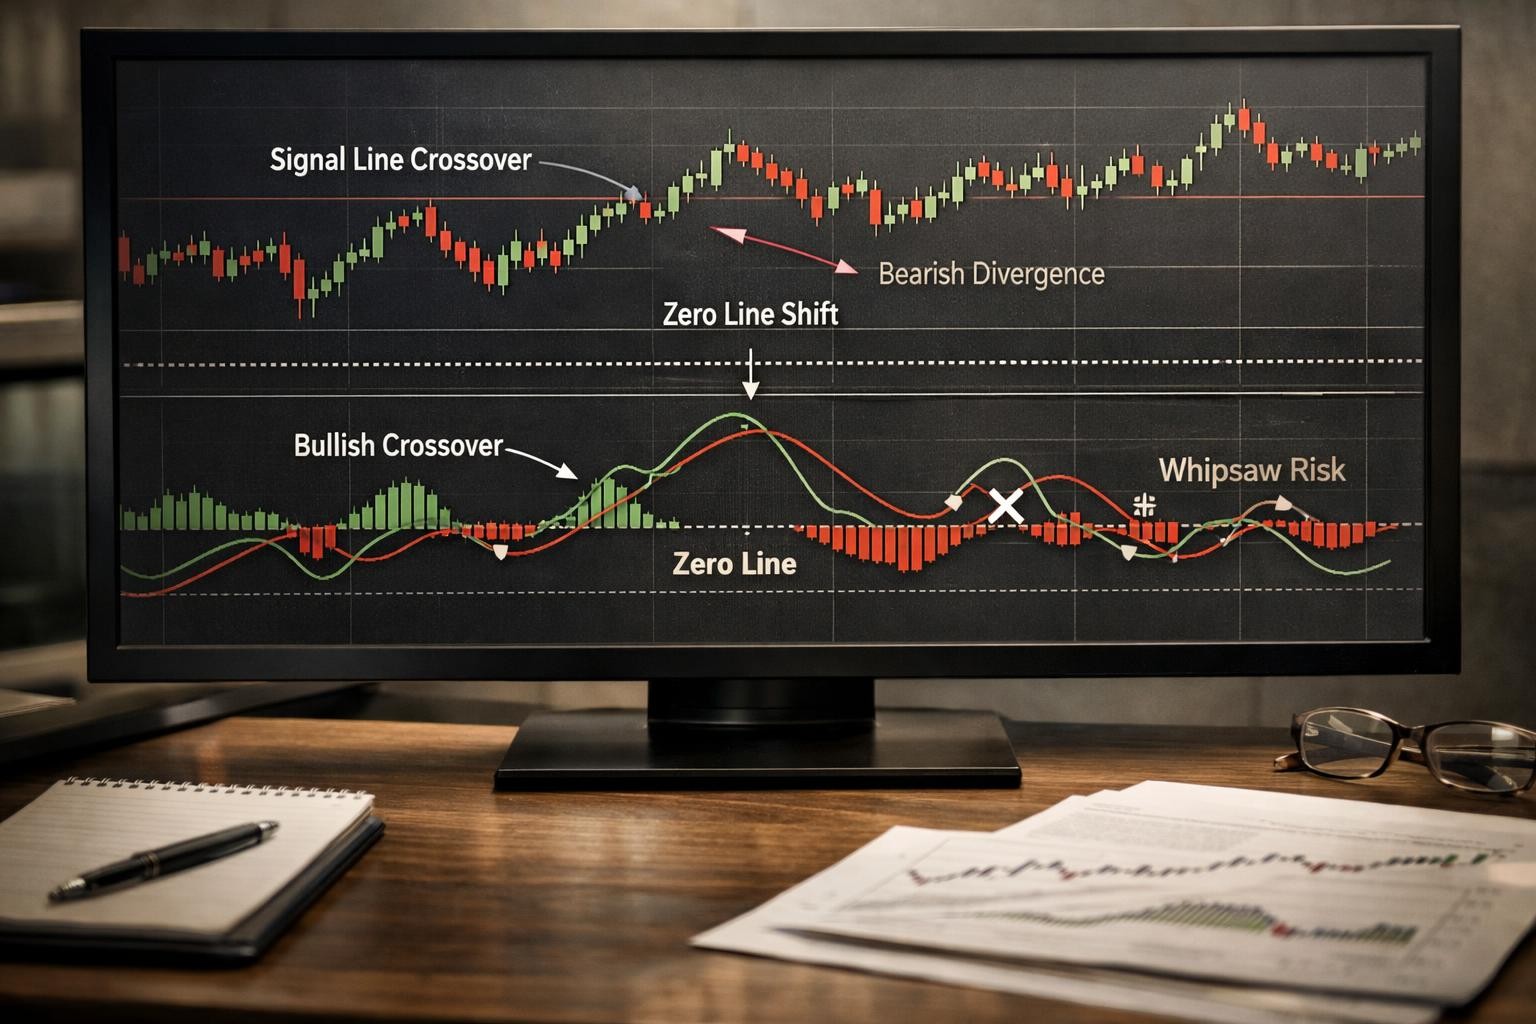
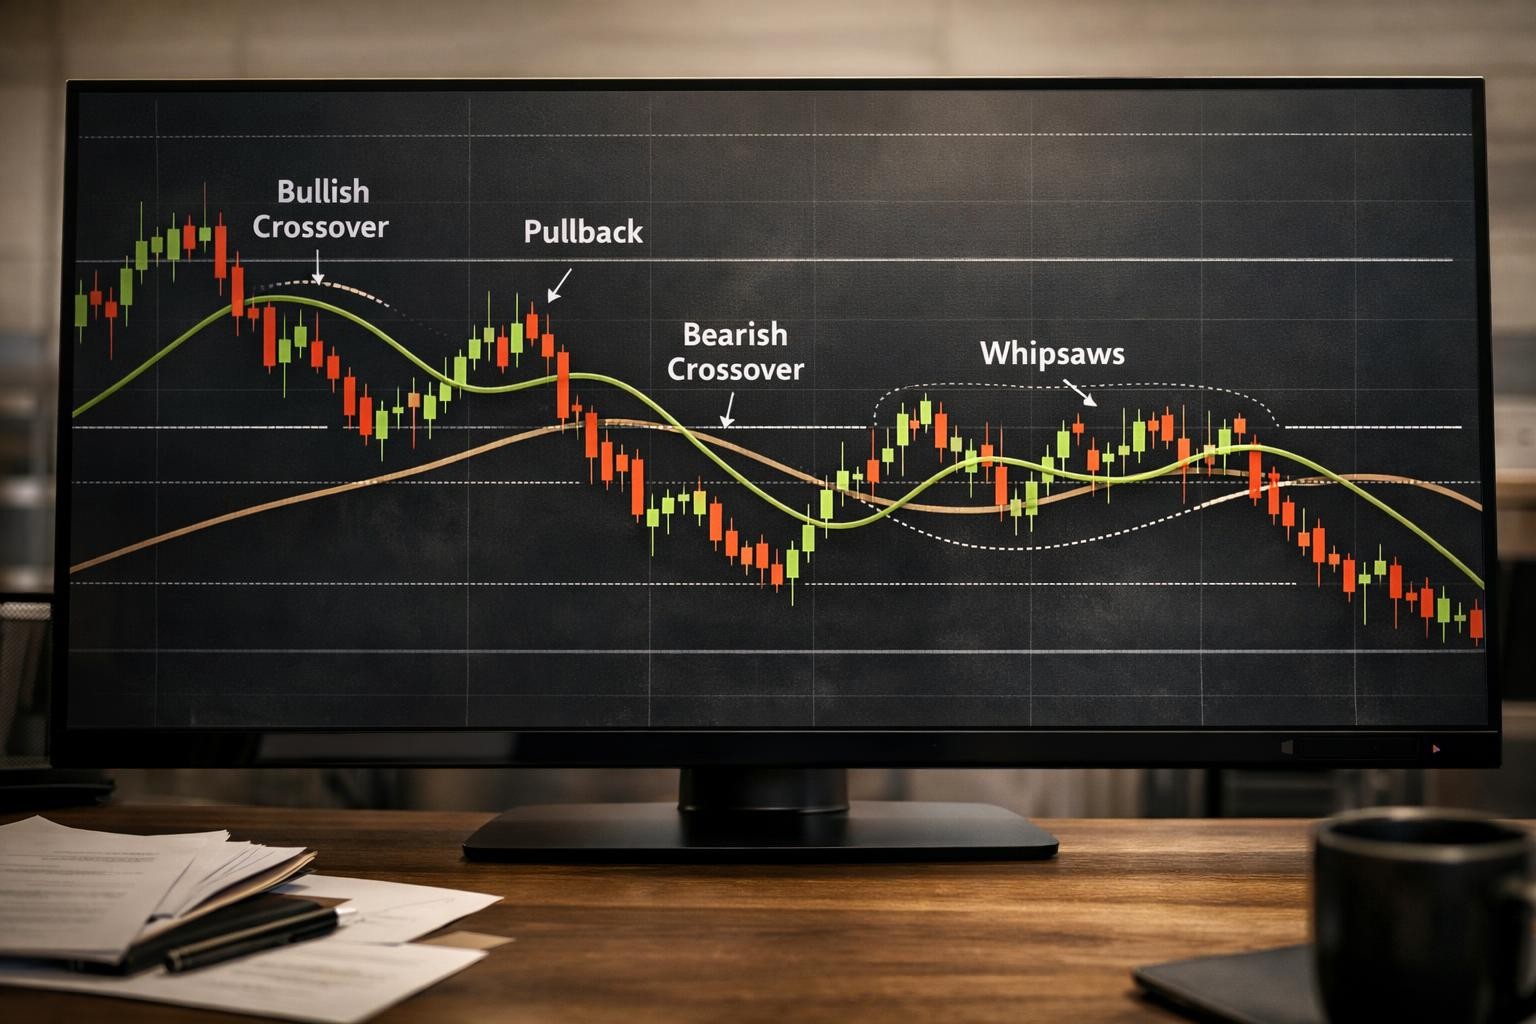
MACD for active traders: signal-line crossovers, zero-line shifts, and how to avoid range-market whipsaws
MACD tracks the distance between a faster and slower moving average, then smooths that relationship with a signal line so traders can judge momentum expansion, contraction, and trend pressure more cleanly. A practical guide for active traders that covers the numbers, rules, examples, and failure modes that actually shape the live decision.
Start Here
Three useful places to begin.
38 articles matching the current view
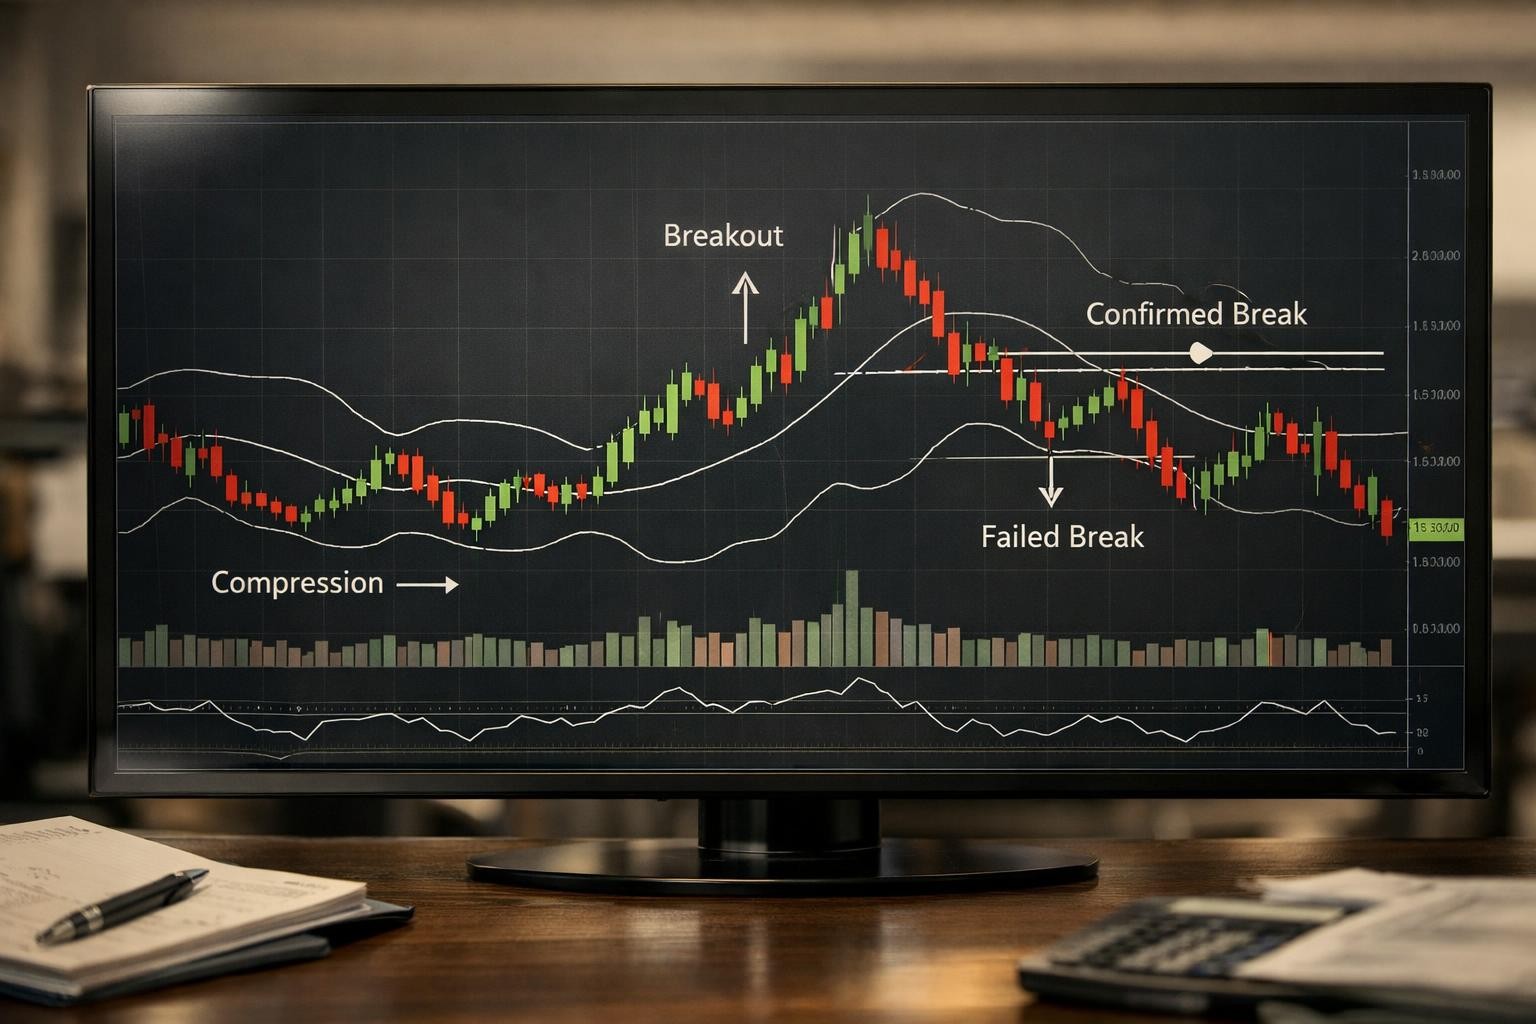
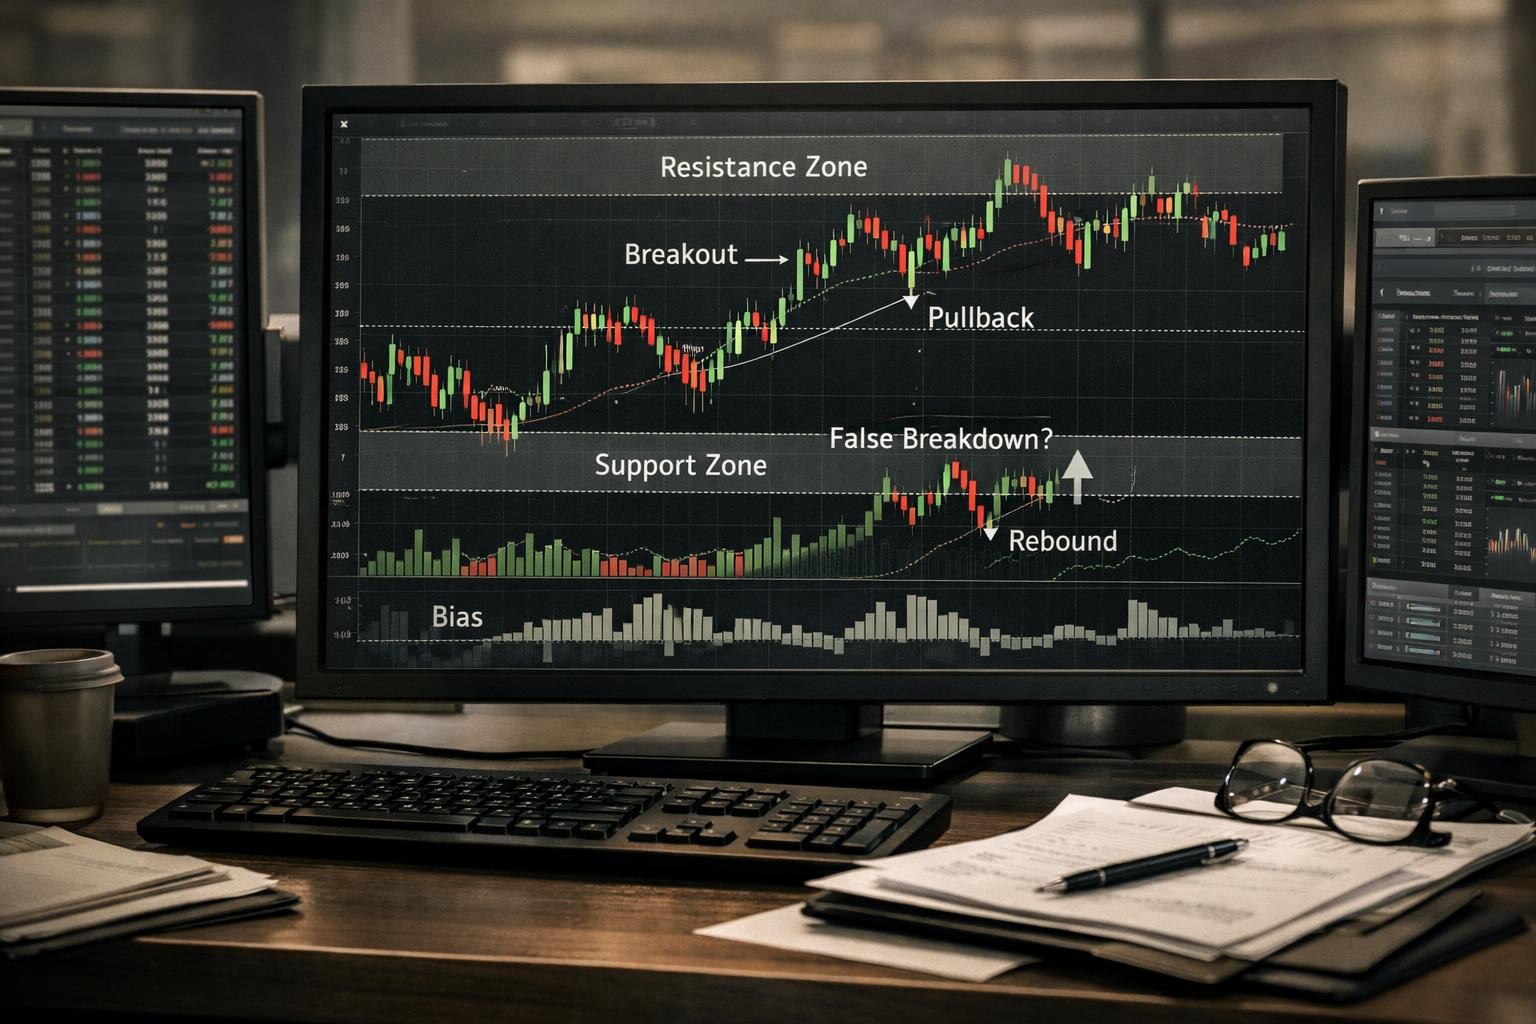
Bollinger squeeze breakout strategy: how traders use volatility compression, breakout confirmation, and failure filters
Bollinger squeeze breakout strategies look for periods of compressed volatility and then try to participate when expansion begins, but the strongest setups still need confirmation that the break is being accepted instead of rejected immediately. A practical guide for active traders that covers the numbers, rules, examples, and failure modes that actually shape the live decision.
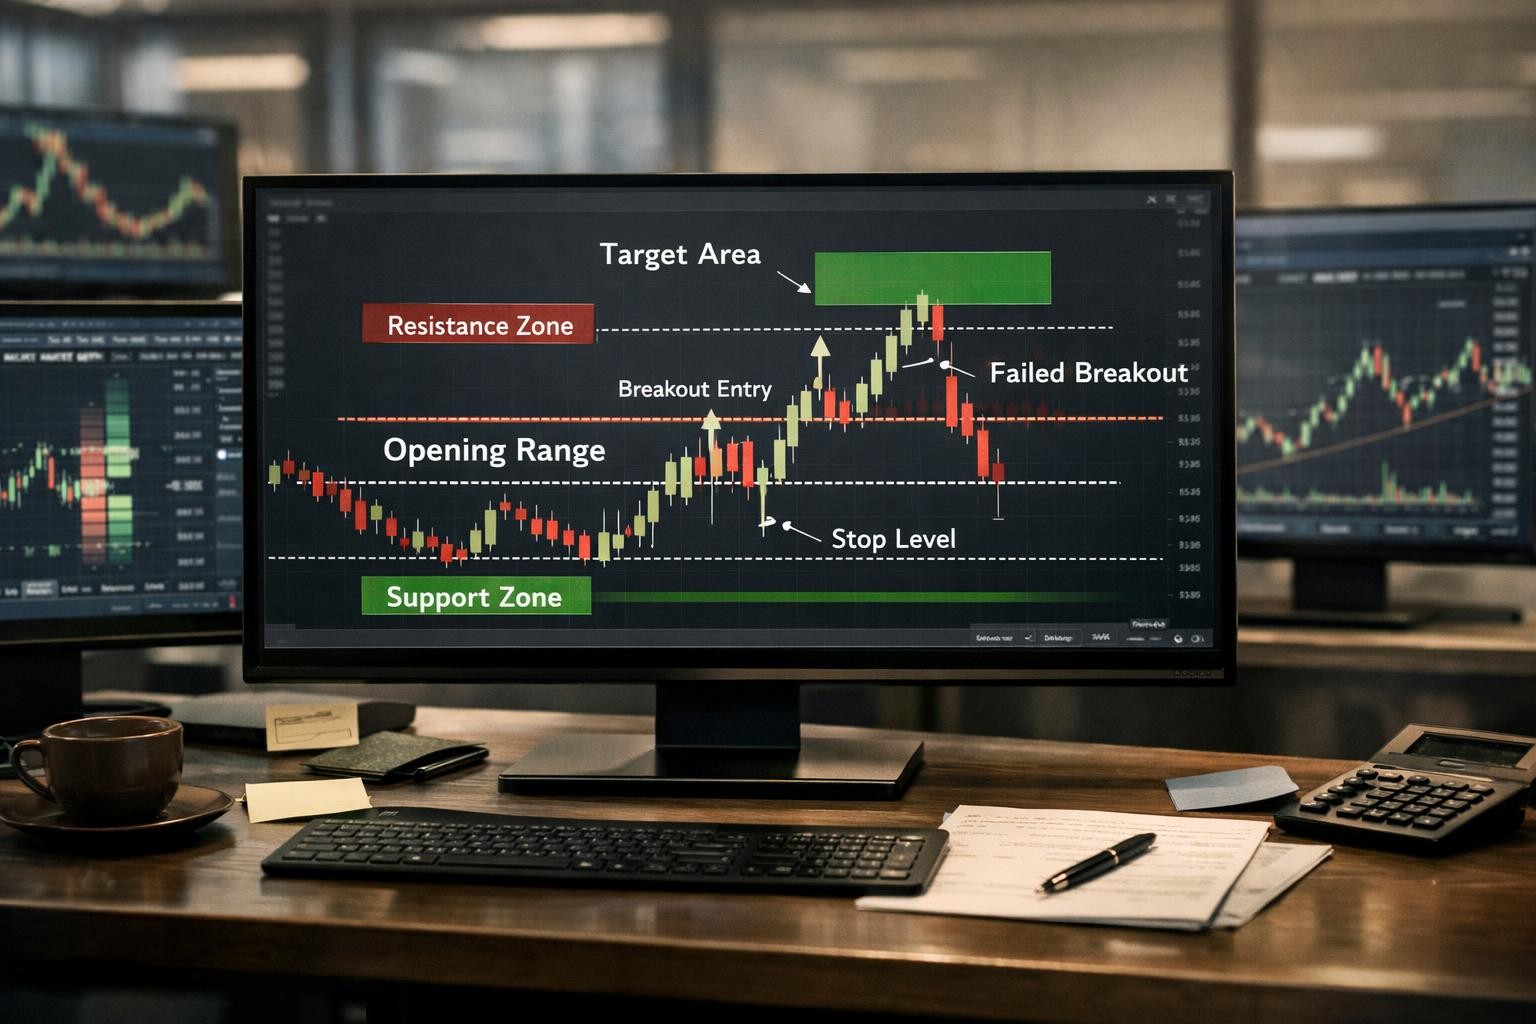
Opening range breakout strategy: how traders define the range now, where breakouts fail, and how to manage targets
Opening range breakout strategies use the initial minutes of a session to define an early reference zone, then look for expansion beyond that range when participation and follow-through support the break. A practical guide for active traders that covers the numbers, rules, examples, and failure modes that actually shape the live decision.
When not to automate a setup: the signs a strategy still needs discretionary review before going live
Some setups should not be automated yet because the context rules are vague, the signal meaning changes trade to trade, or the execution chain still requires human judgment. Automation works best when the decision can already be explained clearly. A practical guide for active traders that covers the numbers, rules, examples, and failure modes that actually shape the live decision.
Archive
Searchable by pillar and topic.
Bollinger squeeze breakout strategy: how traders use volatility compression, breakout confirmation, and failure filters
Bollinger squeeze breakout strategies look for periods of compressed volatility and then try to participate when expansion begins, but the strongest setups still need confirmation that the break is being accepted instead of rejected immediately. A practical guide for active traders that covers the numbers, rules, examples, and failure modes that actually shape the live decision.

Donchian channel breakout strategy: how trend-followers use channel breaks, pullback management, and exit rules
Donchian channels plot the highest high and lowest low over a chosen lookback, which makes them useful for breakout trend-following, trailing exits, and keeping the strategy tied to actual price extremes. A practical guide for active traders that covers the numbers, rules, examples, and failure modes that actually shape the live decision.
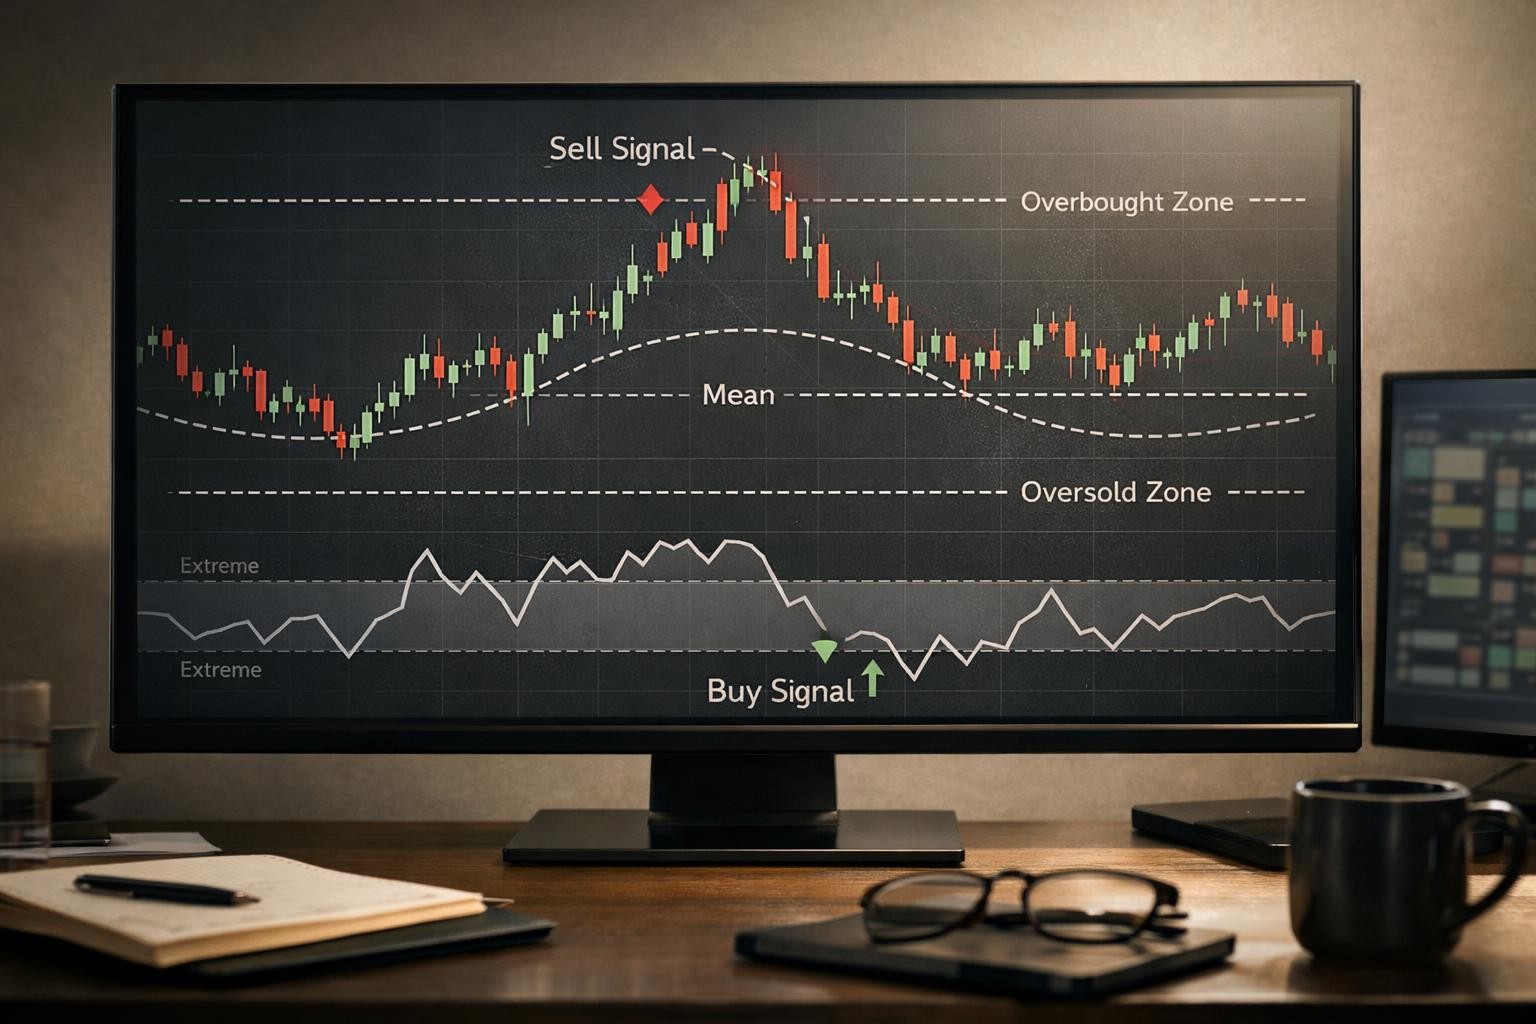
Mean reversion trading strategy: how traders fade stretched moves without catching a falling knife
Mean reversion strategies look for stretched price that is likely to rotate back toward value, but the better versions require context, exhaustion evidence, and disciplined invalidation so traders are not simply fading strong trend pressure. A practical guide for active traders that covers the numbers, rules, examples, and failure modes that actually shape the live decision.

Momentum trading strategy: what strong setups look like, how traders filter them, and why momentum dies in bad context
Momentum strategies look for price that is already moving with enough participation and narrative support to keep going, then try to enter without confusing random speed for durable demand or supply. A practical guide for active traders that covers the numbers, rules, examples, and failure modes that actually shape the live decision.
Opening range breakout strategy: how traders define the range now, where breakouts fail, and how to manage targets
Opening range breakout strategies use the initial minutes of a session to define an early reference zone, then look for expansion beyond that range when participation and follow-through support the break. A practical guide for active traders that covers the numbers, rules, examples, and failure modes that actually shape the live decision.
Moving average crossover strategy: when crossovers work, which period pairs traders use, and how to survive sideways markets
Moving average crossovers try to capture trend shifts by comparing a faster average against a slower one, but the strategy only behaves well when the market is directional enough to reward lagging confirmation. A practical guide for active traders that covers the numbers, rules, examples, and failure modes that actually shape the live decision.
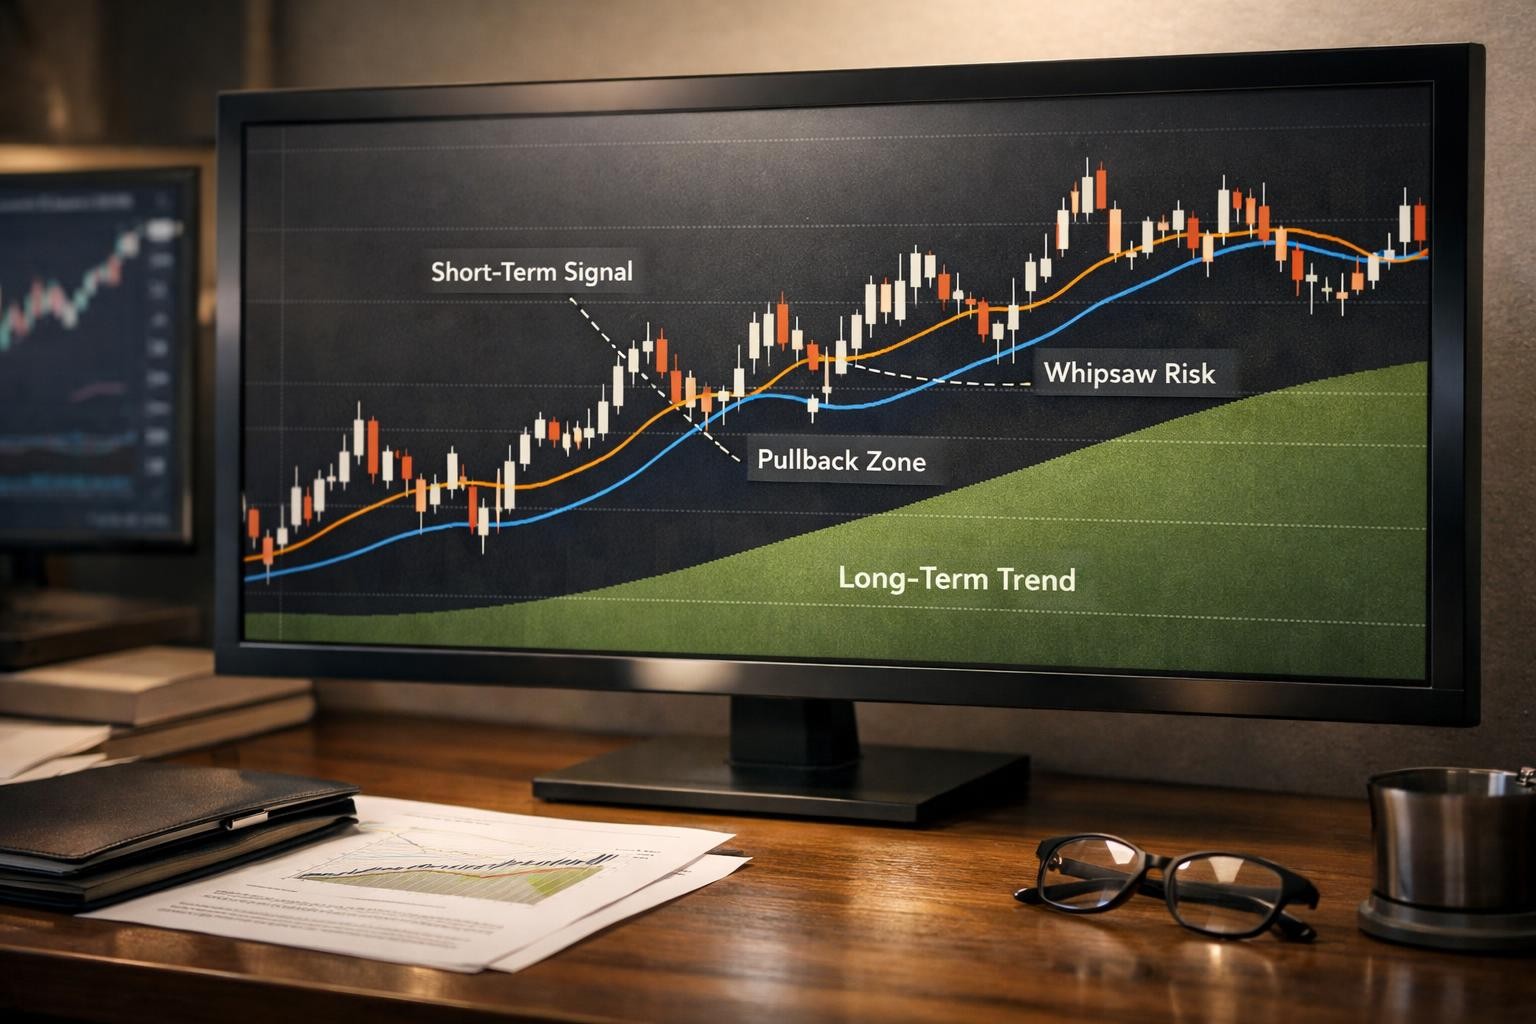
Moving averages for active traders: SMA vs EMA, trend filters, and which periods traders actually use
Moving averages smooth recent price action so traders can judge trend direction, dynamic support-resistance behavior, and the quality of pullbacks without staring at every bar equally. A practical guide for active traders that covers the numbers, rules, examples, and failure modes that actually shape the live decision.
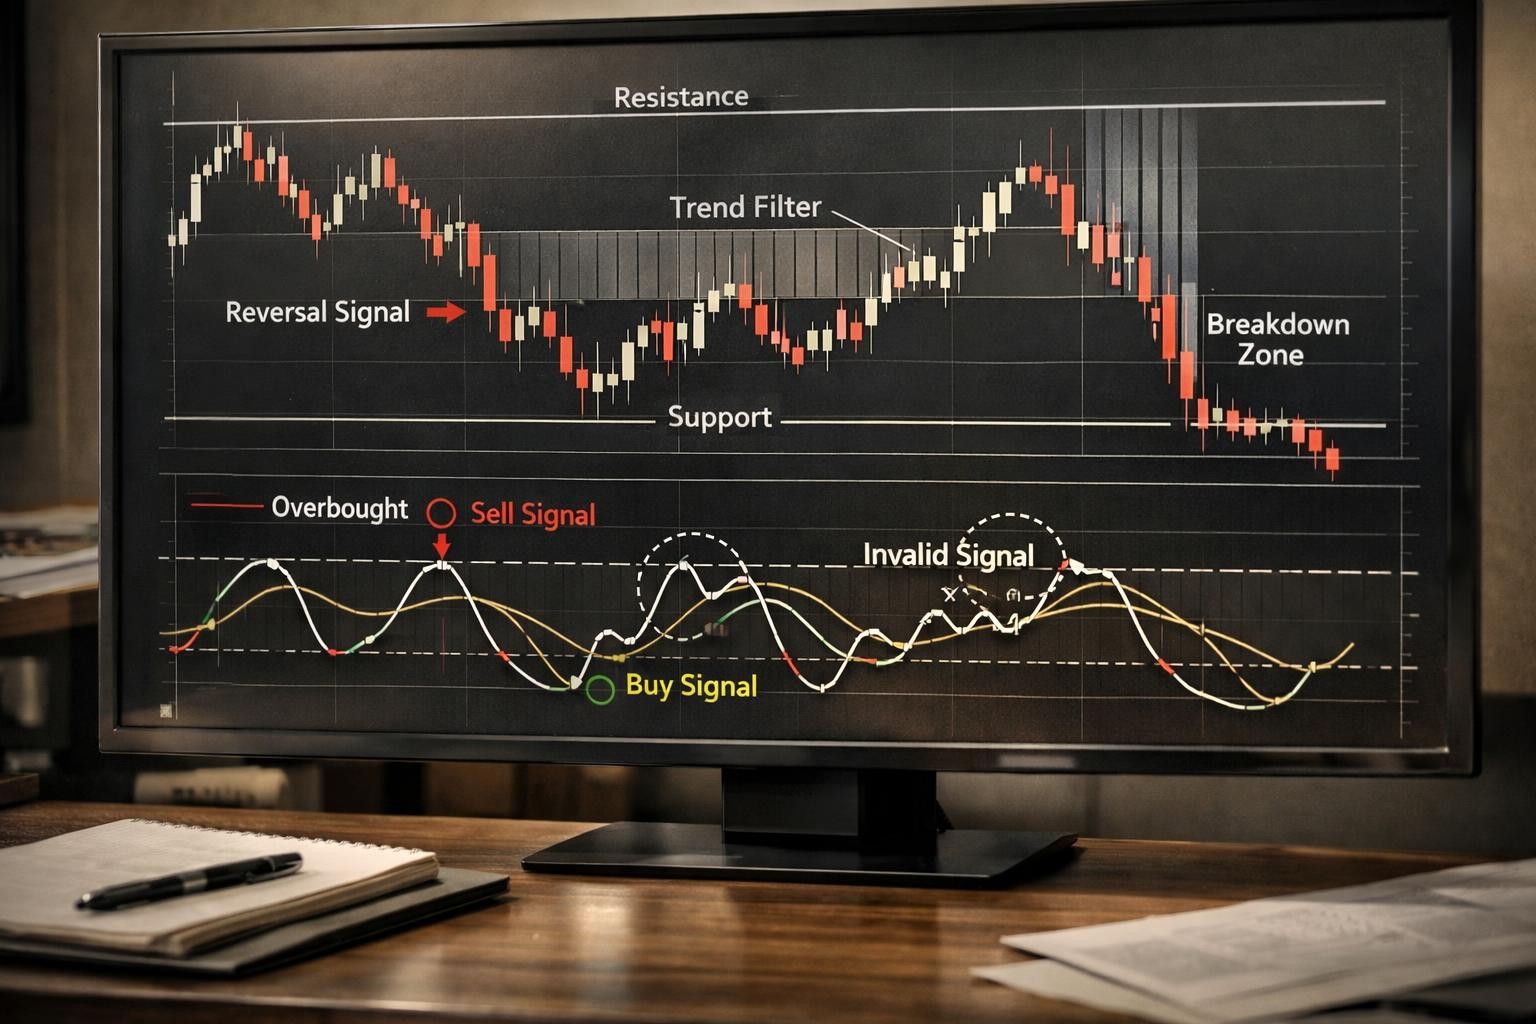
Stochastic oscillator for active traders: reversal timing, trend filters, and where fast signals break down
The stochastic oscillator compares the closing price to the recent range, which makes it useful for judging short-term location, momentum swings, and reversal timing when the regime actually supports that use. A practical guide for active traders that covers the numbers, rules, examples, and failure modes that actually shape the live decision.
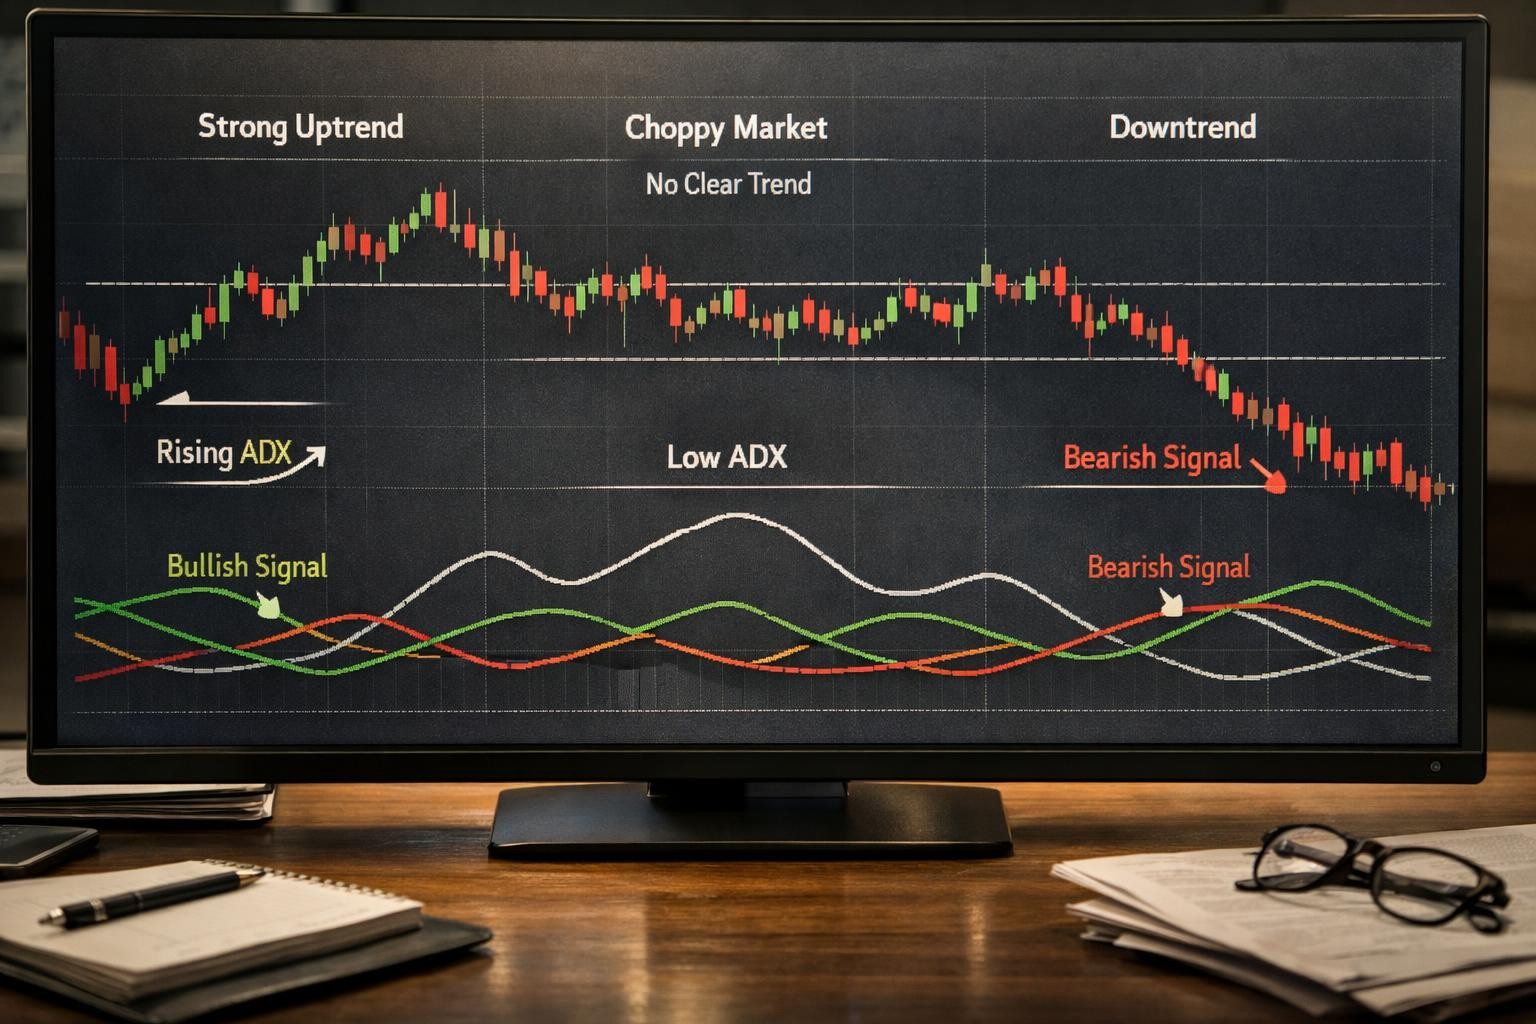
ADX for active traders: how to measure trend strength, use DI crossovers, and stay out of choppy markets
ADX measures trend strength rather than direction, while the positive and negative directional indicators help traders judge which side currently has more control. A practical guide for active traders that covers the numbers, rules, examples, and failure modes that actually shape the live decision.
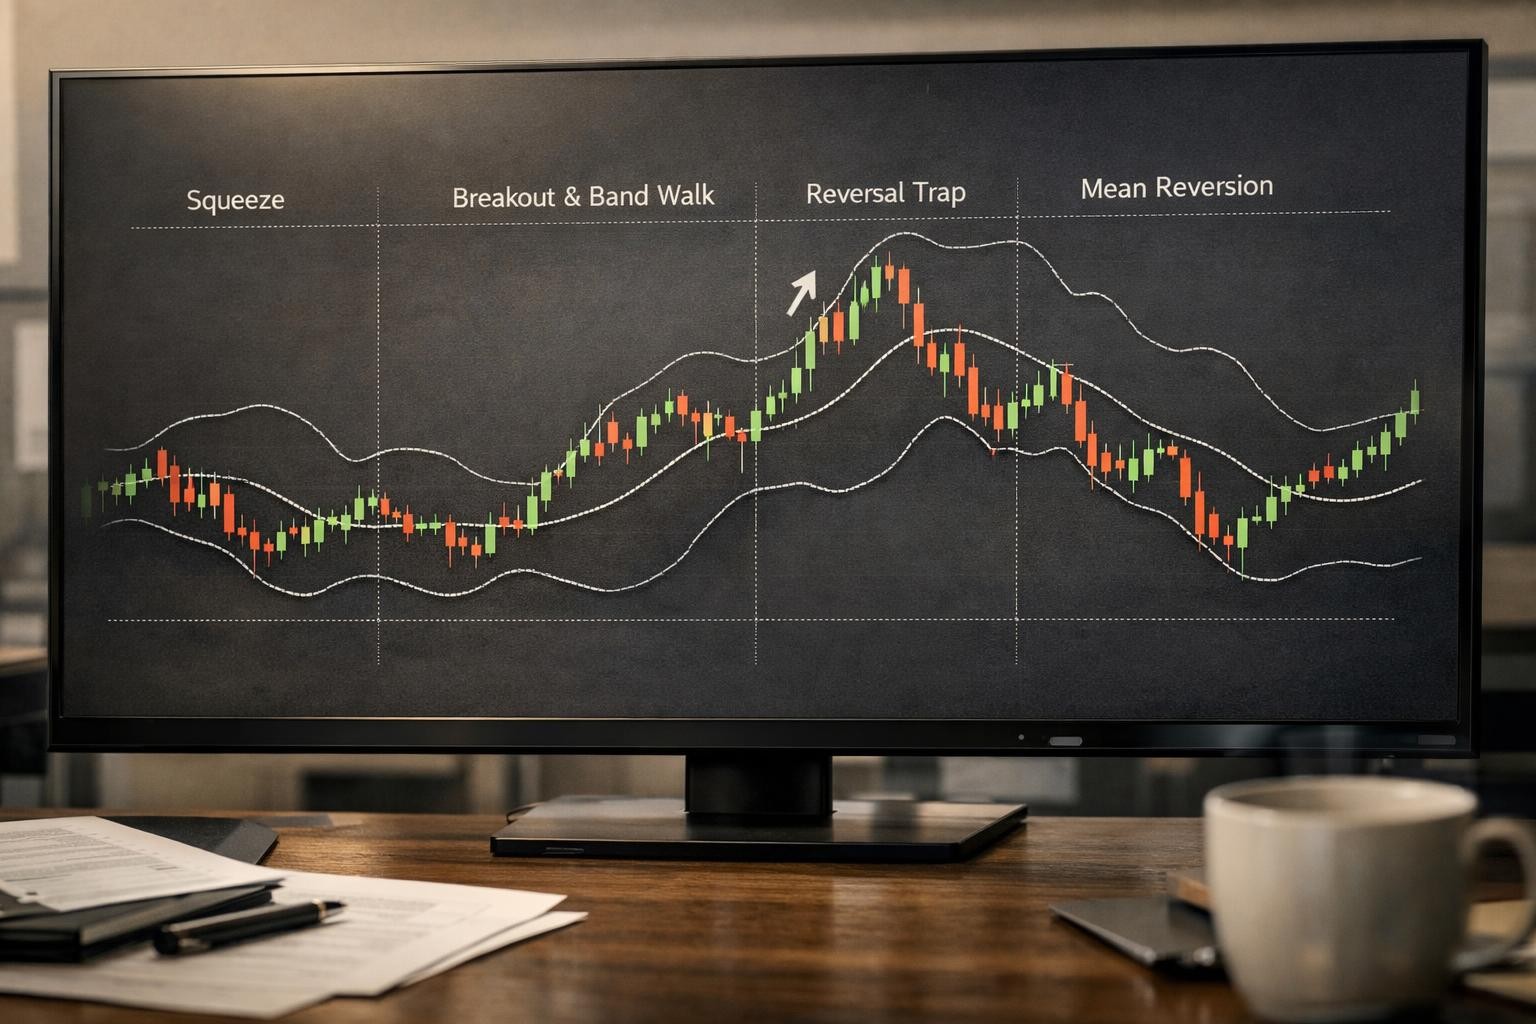
Bollinger Bands for active traders: squeeze setups, band walks, and the reversal traps traders misread
Bollinger Bands combine a moving average with a volatility envelope, which helps traders see compression, expansion, trend persistence, and when stretched price is actually mean-reverting instead of trending cleanly. A practical guide for active traders that covers the numbers, rules, examples, and failure modes that actually shape the live decision.

RSI for active traders: using 30/70, 40/60, and divergence without fading every strong trend
RSI measures the speed of recent price changes on a 0 to 100 scale, which makes it useful for spotting stretch, trend support, and momentum disagreement when traders adjust the interpretation to the market regime. A practical guide for active traders that covers the numbers, rules, examples, and failure modes that actually shape the live decision.

When not to automate a setup: the signs a strategy still needs discretionary review before going live
Some setups should not be automated yet because the context rules are vague, the signal meaning changes trade to trade, or the execution chain still requires human judgment. Automation works best when the decision can already be explained clearly. A practical guide for active traders that covers the numbers, rules, examples, and failure modes that actually shape the live decision.

Execution latency myths in retail automation: what matters, what does not, and where the real failures happen
Retail traders often over-focus on raw latency numbers and under-focus on message quality, state synchronization, routing reliability, and failure handling. In many systems, those boring layers matter more than shaving a few milliseconds. A practical guide for active traders that covers the numbers, rules, examples, and failure modes that actually shape the live decision.

TradingView alert design patterns: writing webhook messages that survive parsing, routing, and broker translation
TradingView alert design patterns should make the message explicit about intent, instrument, side, size logic, and risk instructions so downstream systems do not have to guess what the alert means. A practical guide for active traders that covers the numbers, rules, examples, and failure modes that actually shape the live decision.

Broker failover planning for automated trading: what to document before connection issues become execution problems
Broker failover planning means deciding what the system should do when the normal route is unavailable: pause, reroute, flatten, alert, or wait for human approval. The plan matters before the outage, not during it. A practical guide for active traders that covers the numbers, rules, examples, and failure modes that actually shape the live decision.

Post-trade review checklist: the five questions that expose weak assumptions before they repeat
A post-trade review checklist should expose weak assumptions in context, execution, risk, and behavior so the same error does not quietly repeat across sessions. A practical guide for active traders that covers the numbers, rules, examples, and failure modes that actually shape the live decision.
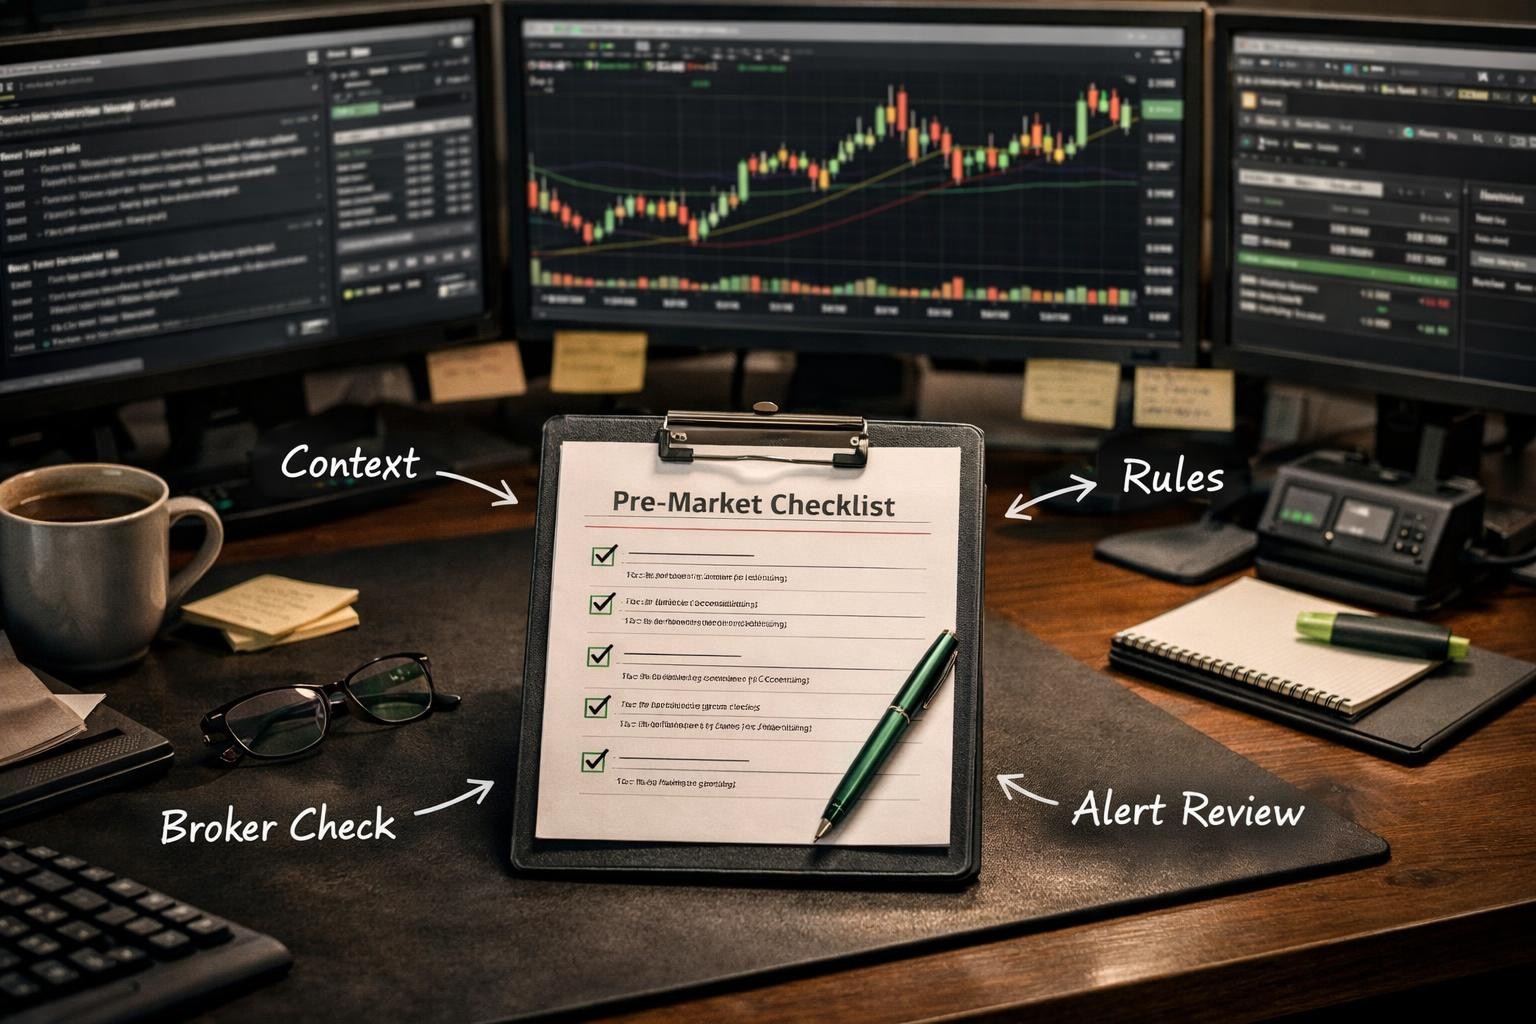
The pre-market checklist for automated traders: what to verify before alerts start routing live
A pre-market checklist for automated traders should verify strategy state, broker state, symbol mapping, risk caps, and failure handling before the market starts moving. The goal is to catch boring problems before they become expensive ones. A practical guide for active traders that covers the numbers, rules, examples, and failure modes that actually shape the live decision.

Position sizing for funded traders: protecting drawdown limits without shrinking every good setup into noise
Funded traders size under hard drawdown rules, so position sizing has to protect both the trade thesis and the account’s survival. The goal is not to trade tiny forever; it is to scale only when the drawdown buffer and setup quality support it. A practical guide for active traders that covers the numbers, rules, examples, and failure modes that actually shape the live decision.

Stop-loss placement for systematic traders: how to exit where the trade thesis actually breaks
A stop loss should mark the point where the original trade idea is no longer valid, not the point where the trader feels most comfortable with the size. Systematic traders need stops that match the setup logic, instrument behavior, and account rules. A practical guide for active traders that covers the numbers, rules, examples, and failure modes that actually shape the live decision.

Divergence setups for active traders: when momentum disagreement matters and when it is just noise
Divergence is a disagreement between price and momentum. It becomes useful when it appears at meaningful location and in the right context, not when traders treat every oscillator mismatch as a reversal signal. A practical guide for active traders that covers the numbers, rules, examples, and failure modes that actually shape the live decision.

Consolidation trading: reading balance, breakout pressure, and failed moves without overtrading the range
Consolidation is balance: price is rotating inside an area where neither side has clear control. Traders need to decide whether they are fading the edges, waiting for breakout acceptance, or staying inactive until pressure resolves. A practical guide for active traders that covers the numbers, rules, examples, and failure modes that actually shape the live decision.

Trendline trading for discretionary traders: where it helps, where it breaks, and how to keep it objective
Trendlines can help organize slope, momentum, and structural deterioration, but only when traders draw them consistently and treat them as context, not as sacred geometry. A practical guide for active traders that covers the numbers, rules, examples, and failure modes that actually shape the live decision.
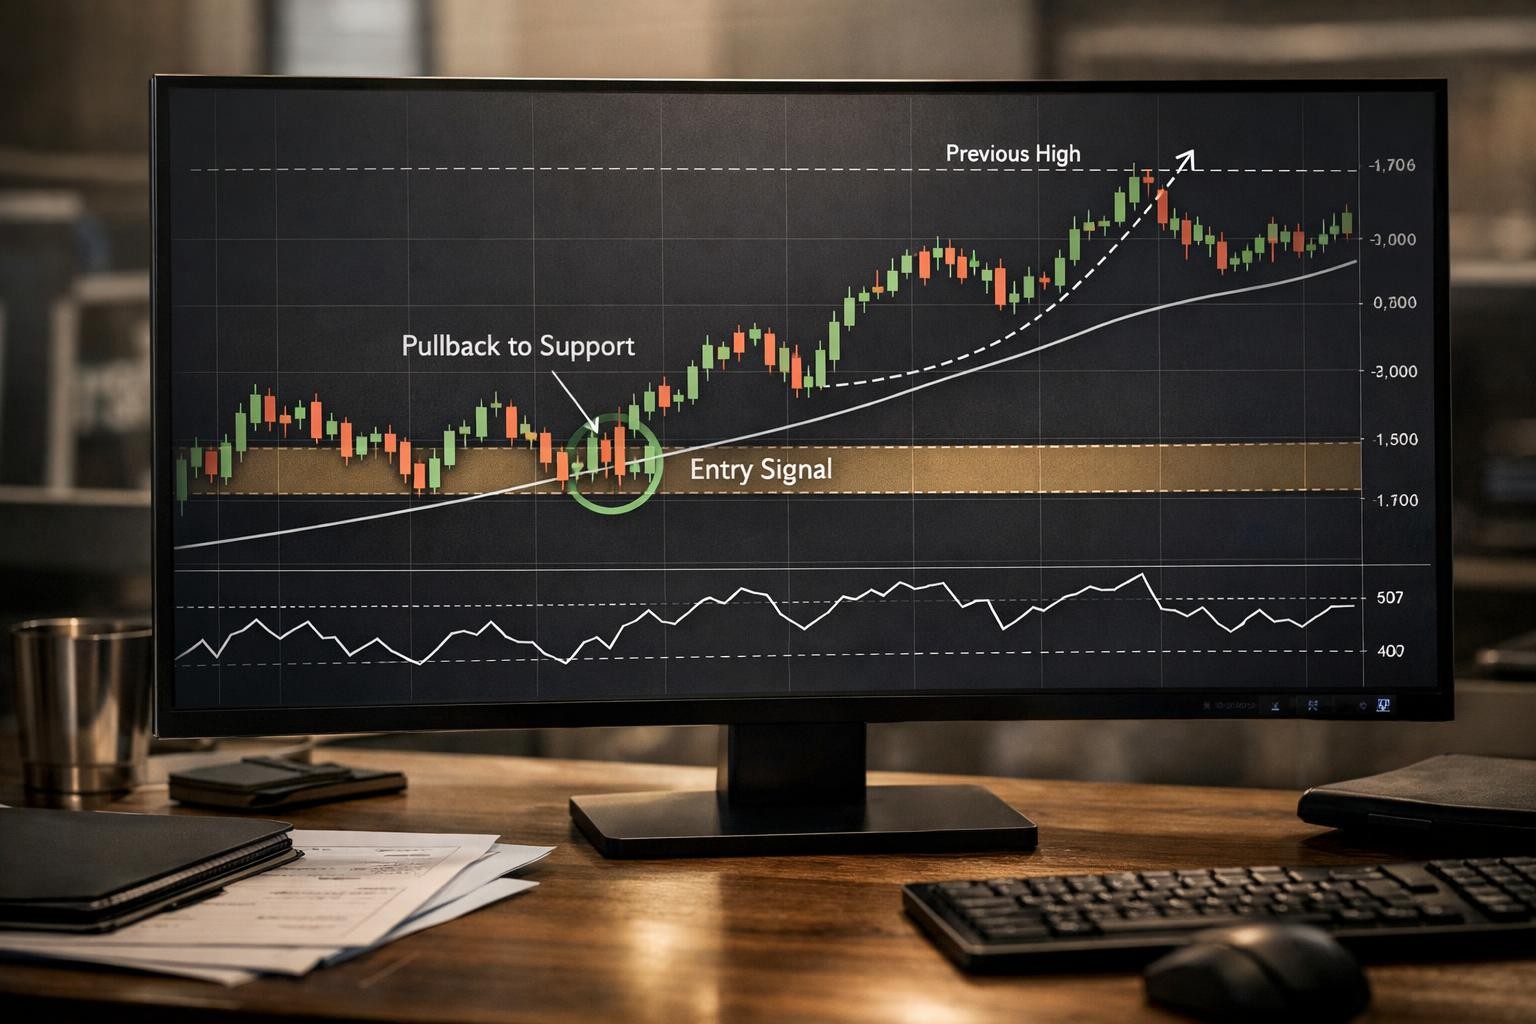
Pullback trading setups: how to separate healthy retracements from low-quality entries
A healthy pullback usually retraces within trend structure, preserves momentum context, and offers a clear invalidation. A low-quality pullback often drifts too deep, loses pace, or occurs in a context where continuation is no longer the better bet. A practical guide for active traders that covers the numbers, rules, examples, and failure modes that actually shape the live decision.
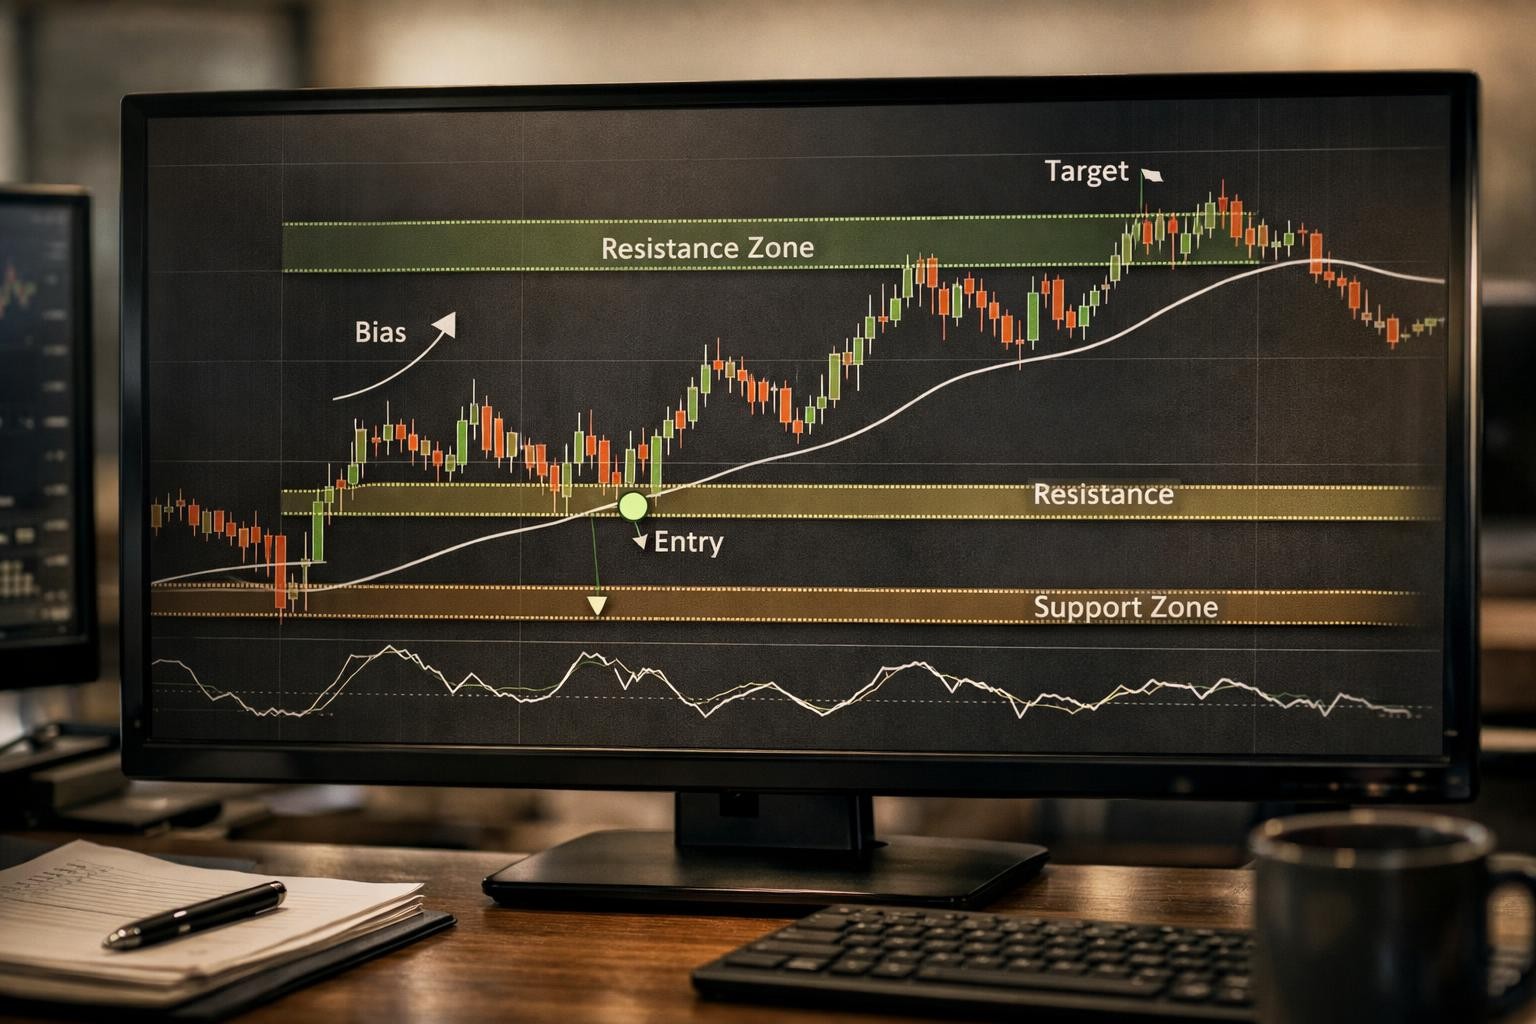
Support and resistance for active traders: how to mark usable levels without cluttering the chart
Support and resistance are decision zones created by prior acceptance, rejection, or trapped inventory. The useful version is not drawing every pivot; it is marking the levels that still change the trade. A practical guide for active traders that covers the numbers, rules, examples, and failure modes that actually shape the live decision.

Backtesting TradingView alerts: what you can validate before going live and what only live execution reveals
Backtesting TradingView alerts can validate rule logic, frequency, and broad expectancy, but it cannot fully validate live delivery, broker routing, slippage, rejects, stale state, or account synchronization. A practical guide for active traders that covers the numbers, rules, examples, and failure modes that actually shape the live decision.

Trading psychology for rule-based traders: emotional control starts in the process, not the pep talk
Rule-based trading psychology is mostly about process design: clear rules, smaller decision load, pre-commitment, and recovery routines. Emotional control improves when the workflow removes unnecessary ambiguity, not when the trader repeats generic mindset slogans. A practical guide for active traders that covers the numbers, rules, examples, and failure modes that actually shape the live decision.

Trading journal workflow: what to review after each session if you want better decisions instead of more screenshots
A useful trading journal is not a scrapbook. It is a review workflow that captures context, decision quality, execution quality, and the next process change so the trader can improve future decisions rather than merely archive charts. A practical guide for active traders that covers the numbers, rules, examples, and failure modes that actually shape the live decision.

Reward-risk ratio for traders: why clean R-multiples still fail without context and execution discipline
Reward-risk ratio only matters when the trader can actually execute the setup with the planned stop, size, and target. Clean R multiples do not save poor context, late entries, or unrealistic target placement. A practical guide for active traders that covers the numbers, rules, examples, and failure modes that actually shape the live decision.
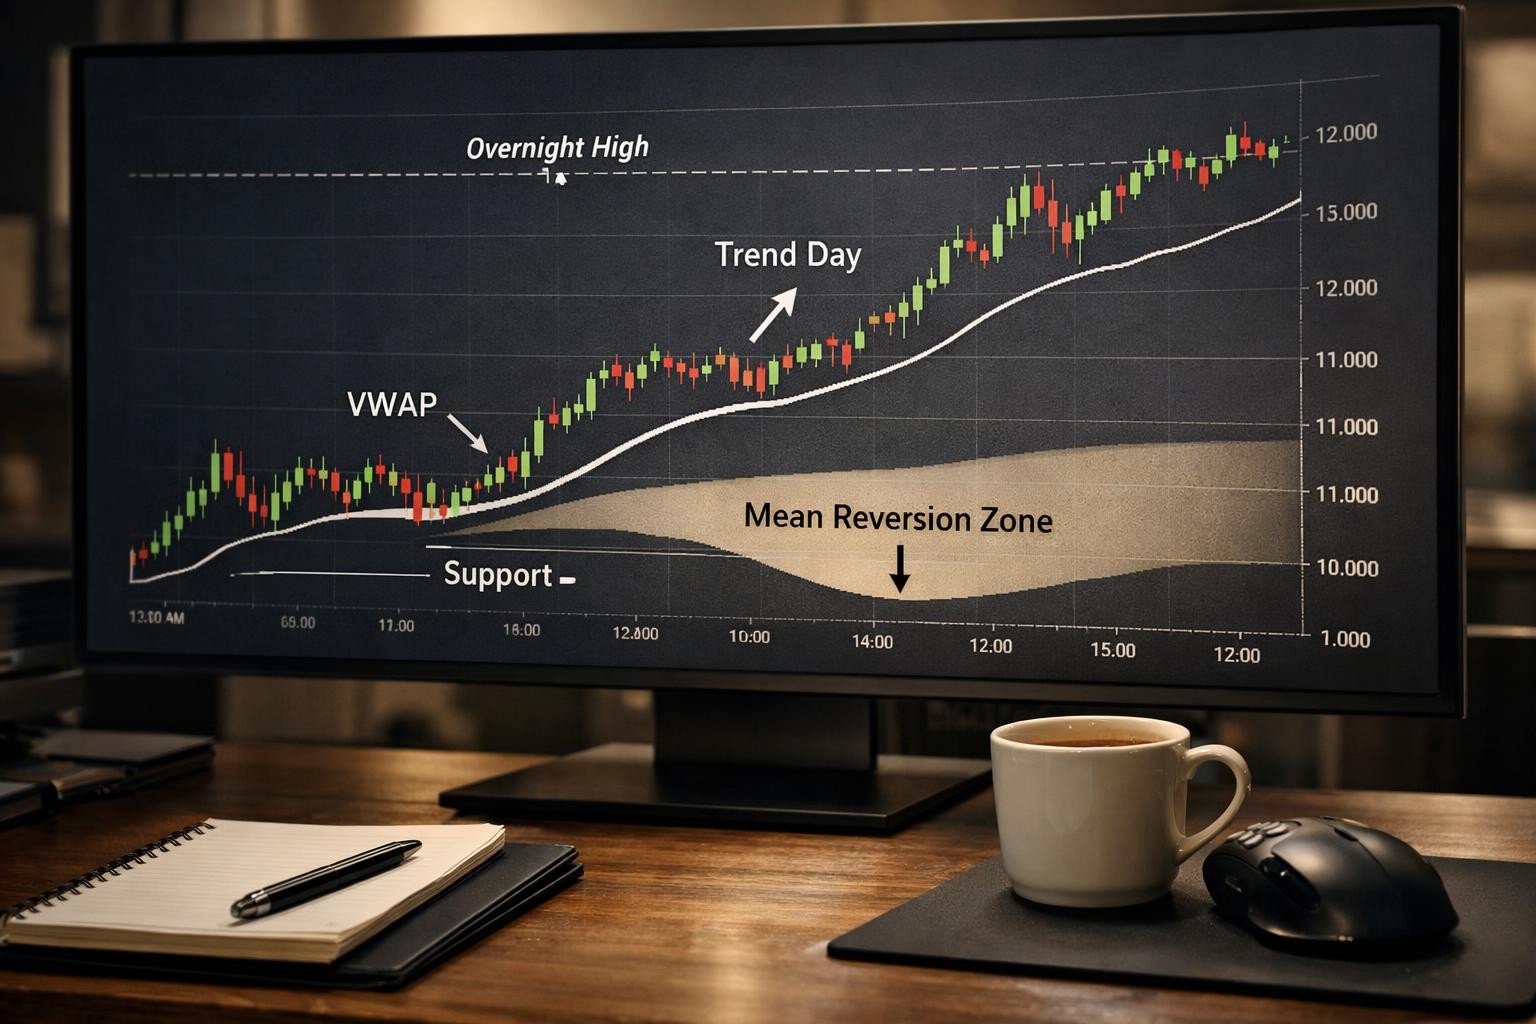
VWAP for active traders: what it actually tells you, what it does not, and how to use it cleanly
VWAP is the session’s volume-weighted average price, which makes it a fair-value reference for the current session. It helps most when traders use it to classify context, not when they treat every touch as a signal. A practical guide for active traders that covers the numbers, rules, examples, and failure modes that actually shape the live decision.

Supply and demand zones for active traders: how to map them without turning every chart into hindsight
Supply and demand zones are areas where price left quickly after an imbalance. The useful version is not drawing every pause; it is isolating the zones that still matter and pairing them with structure, reaction quality, and risk. A practical guide for active traders that covers the numbers, rules, examples, and failure modes that actually shape the live decision.

Multi-timeframe analysis for futures traders: when higher timeframe context helps and when it creates hesitation
Multi-timeframe analysis is a top-down process: use higher timeframes to define location and structure, then use lower timeframes to refine entry and risk without letting the smaller chart overrule the larger context. A practical guide for active traders that covers the numbers, rules, examples, and failure modes that actually shape the live decision.

What funded traders should know about automation, drawdown discipline, and account hygiene
Funded traders have to treat automation, drawdown discipline, and account hygiene as one operating system. A strategy can be technically valid and still fail the account if size, daily limits, payout rules, or duplicated routing behavior are not handled cleanly. A practical guide for active traders that covers the numbers, rules, examples, and failure modes that actually shape the live decision.

TradingView automation checklist: what traders should verify before going live
A TradingView automation checklist is a pre-live verification routine for the full signal path: chart logic, alert syntax, payload fields, routing assumptions, broker mapping, risk controls, and fail-safe behavior when reality does not match the plan. A practical guide for active traders that covers the numbers, rules, examples, and failure modes that actually shape the live decision.

How automated trading workflows actually break when markets get fast
Trading automation is the set of checks that make sure a trading idea survives alert delivery, routing, and broker translation without relying on guesswork. A practical guide for active traders that covers the numbers, rules, examples, and failure modes that actually shape the live decision.

Why signal quality matters more than adding another broker or another automation layer
Signal quality is the integrity of the trading idea before it touches routing, broker selection, or automation. Weak signal logic does not become stronger because it reaches more brokers or moves through a fancier execution stack. A practical guide for active traders that covers the numbers, rules, examples, and failure modes that actually shape the live decision.
Futures market structure for active traders: separating real pressure from noisy movement
Futures market structure is the framework traders use to read location, acceptance, imbalance, and response quality. The core job is separating meaningful pressure from movement that looks active but does not actually change the auction. A practical guide for active traders that covers the numbers, rules, examples, and failure modes that actually shape the live decision.

Your execution stack is only as strong as its weakest assumption
Execution stack is the set of checks that make sure a trading idea survives alert delivery, routing, and broker translation without relying on guesswork. A practical guide for active traders that covers the numbers, rules, examples, and failure modes that actually shape the live decision.
Collections
Browse by research pillar.
Routing, webhook design, execution hygiene, broker resilience, and live automation operations.
Execution latency myths in retail automation: what matters, what does not, and where the real failures happen
20 min read
TradingView alert design patterns: writing webhook messages that survive parsing, routing, and broker translation
20 min read
Broker failover planning for automated trading: what to document before connection issues become execution problems
20 min read
Auction logic, context, intraday narrative, balance, breakout pressure, and futures session structure.
Opening range breakout strategy: how traders define the range now, where breakouts fail, and how to manage targets
22 min read
Consolidation trading: reading balance, breakout pressure, and failed moves without overtrading the range
18 min read
Multi-timeframe analysis for futures traders: when higher timeframe context helps and when it creates hesitation
20 min read
Actionable indicator use, chart structure, level selection, and pattern interpretation for active traders.
MACD for active traders: signal-line crossovers, zero-line shifts, and how to avoid range-market whipsaws
25 min read
Bollinger squeeze breakout strategy: how traders use volatility compression, breakout confirmation, and failure filters
22 min read
Donchian channel breakout strategy: how trend-followers use channel breaks, pullback management, and exit rules
22 min read
Stops, sizing, drawdown control, failure-mode planning, and process that protects capital under pressure.
Emotional regulation, discipline, routine design, and the process habits that reduce self-sabotage.
Review loops, journaling, playbooks, checklists, and the operating routines behind better trading decisions.
When not to automate a setup: the signs a strategy still needs discretionary review before going live
18 min read
Post-trade review checklist: the five questions that expose weak assumptions before they repeat
18 min read
Trading journal workflow: what to review after each session if you want better decisions instead of more screenshots
18 min read
Prop-firm rules, drawdown discipline, funded account hygiene, and workflow decisions built for evaluation constraints.